Project Concept
This project presents an infographic based on a database of student mental health gathered in 2023. The database reflects factors that may influence the levels of stress, anxiety, and depression among students from various disciplines. The goal of the project is to demonstrate that common perceptions of student mental health may not align with reality.

The culmination of the research and visualization is a poster that reflects the core message of the project.
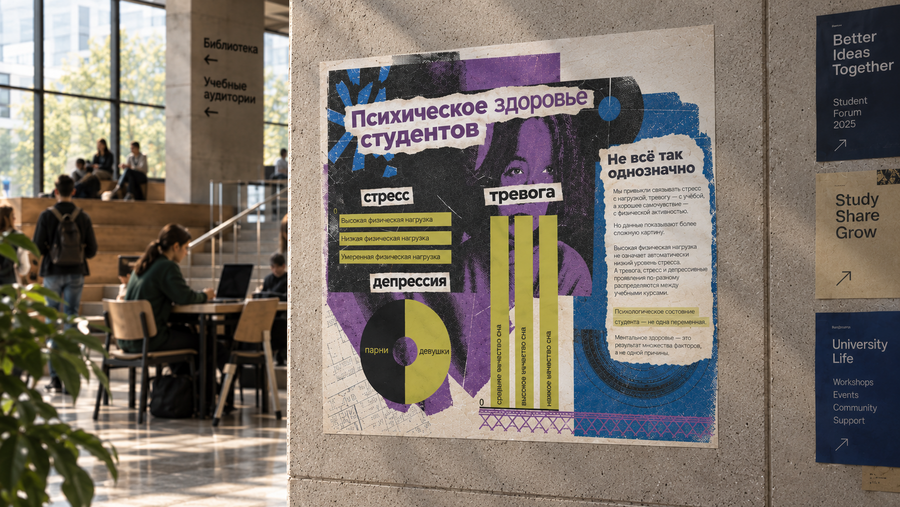
Poster in the university environment
Poster in the library
Poster in the coffee shop
The Creation Process
Initially, the database was analyzed using Google Sheets to correlate levels of stress, anxiety, and depression with physical activity, sleep quality, and gender. Using the same Google Sheets, preliminary infographics were constructed based on the analysis to visualize specific data points.
To select a visual style and color palette appropriate for the project theme, an analysis was conducted using ChatGPT. The collage aesthetic was recreated using the Recraft neural network, and the poster layout was edited in Adobe Photoshop to reach the final version.
The infographic itself was manually compiled in the Figma application on a poster mock-up. The text, which reflects the core message of the infographic and the entire project, was generated using Chat GPT.